
This post highlights the financial problems caused by (the reaction to) the coronavirus. I look at the balance sheets and cash flows of five sectors. The five sectors are (1) businesses that continue operations, (2) businesses that are closed due to the coronavirus, (3) households, (4) the government and (5) banks.
Key findings:
- Businesses face a cash crunch
- The net worth of households falls by about 50% of GDP due to lower stock prices
- Each month of lockdown costs about 2% of annual GDP
- The accrual of fixed costs while revenue is down is the fundamental problem of the corona crisis
- Loans and tax deferrals can prevent bankruptcies for a while
- However, loans and tax deferrals don’t protect businesses and households against insolvency
- Therefore, the government should transfer resources to those hit by the crisis
- Fiscal consolidation after the health crisis is over imperils the recovery
Warning: this is a long article. If you’re familiar with accounting, you can go straight to The corona shocks. However, I recommend that you first have a look at the figures in the chapter Steady state before the crisis to familiarize yourself with my notation. The subsection on cash flows uses my money flow matrix notation, which is not textbook material.
A consistent model based on financial observables
In this post, I construct a simple, stock-flow consistent model of the economy. The building blocks are accounting observables: assets, liabilities, cash and payments.
The model is inspired by the sectoral balances approach, but with some modifications.
Economic agents are grouped into five sectors.
The non-financial corporate (NFC) sector is split into two categories:
Companies that stay open during lockdown (NFC_O), for example supermarkets, pharmacies, accountants and utilities.
Companies that are closed1 during lockdown (NFC_C), for example hotels, restaurants, airlines and certain factories. NFC_C includes the professional activities of self-employed people who lose their income due to the virus (e.g. cosmetologists, barbers or certain freelancers).
Natural persons are aggregated into the sector Households (HH)2.
Local, regional and federal government entities are aggregated into the sector Government (Gov).
Credit institutions (including the central bank) are aggregated into the sector Bank.
The model has no foreign sector. There is only one currency.
Steady state before the crisis
Balance sheets
Figure 1 shows the balance sheets of the five sectors.
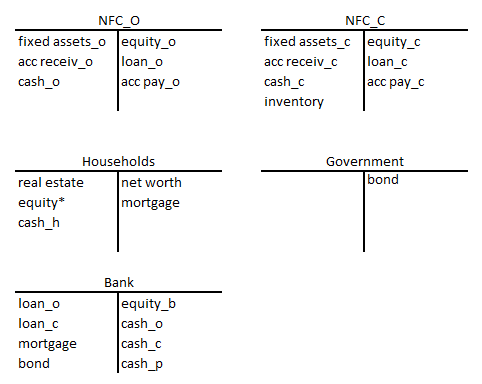
The two non-financial corporate categories have similar assets and liabilities. That’s why they are labeled with an appendix (“_o” for NFC_O and and “_c” for NFC_C).
NFC_O has three types of assets. Fixed assets are things like land, buildings, machines or trucks. Acc receiv stands for accounts receivable, basically invoices that customers haven’t paid yet. Cash is shorthand for currency and bank deposits.
NFC_O also has liabilities. Loan is money owed to the Bank sector (see further). Acc pay stands for accounts payable, i.e. invoices that the company hasn’t yet paid to its suppliers. Equity is calculated by subtracting loan and acc pay (both money owed to others) from the company’s assets.
NFC_C also has an inventory asset. This will be relevant for our analysis of the corona shock (figures 13 and 14).
Households have three assets: real estate (land, houses…), cash and equity*. The asterix after equity* indicates that this is the market value of shares held by HH. So equity* is not equal to the sum of the book values of NFCs and banks!
The liabilities of households are labeled mortgage. Mortgage includes actual mortgages (money borrowed to buy real estate) and other consumer credit. The net worth of HH is the value of their three assets minus mortgage.
Government only has one liability in this model: a bond. Obviously, in reality governments also have assets like cash and real estate, but we ignore that here.
The assets of Bank are credit to the other sectors: loans (loan_o and loan_c) to businesses, mortgage to households and bond to the government. The liabilities of bank are the cash (currency3 and deposits) of the other sectors (cash_o, cash_c and cash_h).
Note that all liabilities are somebody else’s assets4. The reverse is not true; not all assets are somebody else’s liabilities. For example, the real estate asset of HH does not show up as a liability of another sector.
In the steady state, we assume that the balance sheets of the five sectors are constant at the end of each time period.
Cash flows
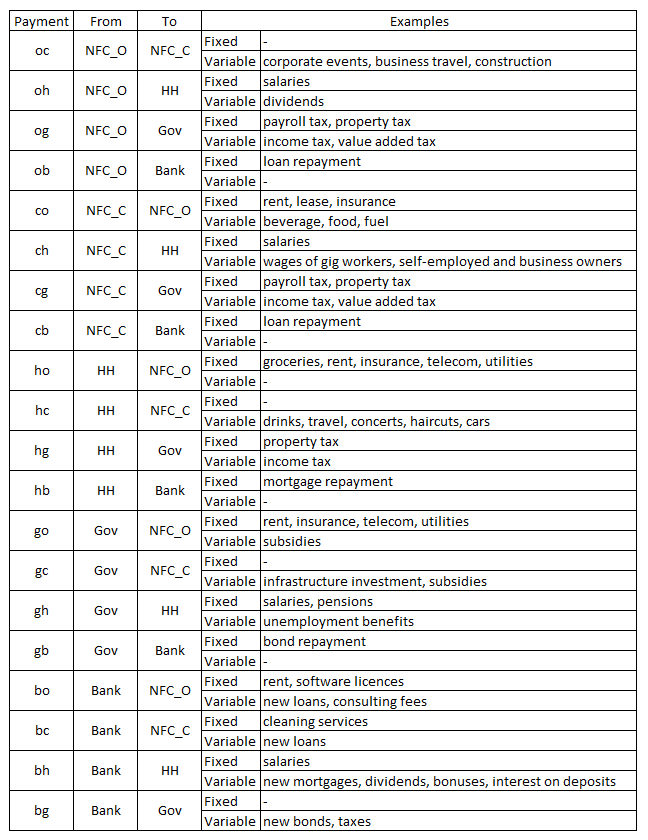
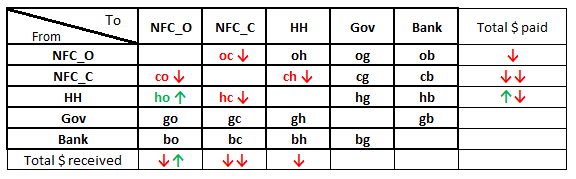
Figure 2 shows the cash flows between the five sectors.
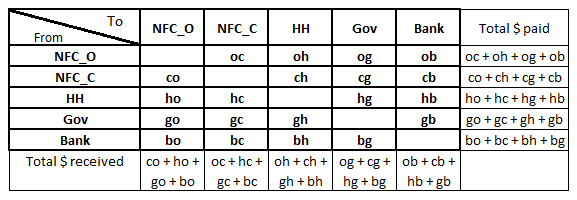
The horizontal rows show the payments from the sector in the leftmost cell to the other sectors. So for example, households (HH) make a payment ho to NFC_O, a payment hc to NFC_C, etc.
The rightmost cell of the rows shows the total spending of each sector.
The vertical columns show the payments received by each of the five sectors.
Excluding the bank sector5, the total expenditure (i.e. money paid) is equal to the total income (i.e. money received)6.
However, in the steady state we assume that the total expenditures do equal the total income for the entire economy7. The principal of new loans and the costs8 paid by banks is matched by repayment (principal and interest) of old loans.
The corona shocks
We’ll look at the impact of the coronavirus on the non-financial private sector (open businesses NFC_O, closed businesses NFC_C, and households HH) first. The reaction of the government and banks will be discussed in the next two chapters.
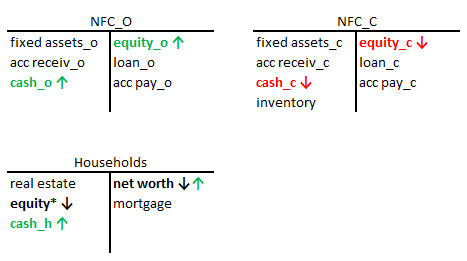
The foreshock: falling equity prices
The coronavirus first manifested itself economically in equity prices9. Stock markets dropped about 33% in the month after February 20th. Although the value of private equity is harder to determine, it makes sense that shares of unlisted companies also became less valuable10.
The drop in equity* reduces the net worth of households (figure 4). Arrows indicate the change relative to the pre-corona steady state. The book value of the equity of non-financial corporates and banks doesn’t change at this stage. The cash flows remain the same (not shown).
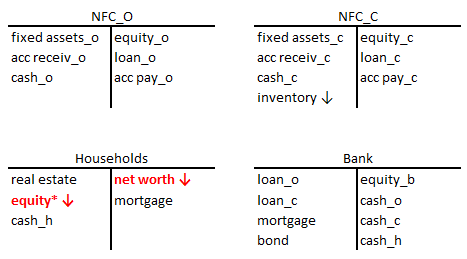
How big a drop in net worth are we talking about?
If aggregate profits11 are 10% of GDP and the average P/E ratio is 15, equity* is worth 150% of annual GDP. A 33% drop in prices means households’12 financial assets lost 50% of GDP in value.
The sudden stop
From the beginning of March onwards, the coronavirus started to hurt the real economy. Travel and tourism plummeted. Schools, bars and restaurants were closed.
Figure 5 shows the cash flows when the NFC_C is closed. Households and open businesses no longer spend money at NFC_C. NFC_C spend less money at NFC_O. For example, bars no longer buy beer from brewers. NFC_C also spends less to HH, e.g. because gig workers are no longer hired.
As you can see in figure 5, HH shift a part of their expenditures from closed to open businesses. For example, people who used to eat out now buy food in the supermarket. They shop online instead of in brick and mortar stores.
How big are the cash flow shifts?
We want a ballpark figure, so don’t pin me down on the exact numbers. Suppose:
- HH spend 30% of GDP at NFC_C and 40% at NFC_O during normal times.
- Once NFC_C is closed, there is a 6% GDP revenue shift from NFC_C to NFC_O.
- Half of NFC_C’s normal revenue (15% of GDP) goes to HH.
- Due to closures, NFC_C only pay 5% of GDP to HH during corona.
- Government increases transfers13 to HH by 4% during corona.
Household spending and GDP drop 24%14. Household income drops 6%15.
Every month that businesses are closed due to the coronavirus:
Keep in mind that these are aggregate HH numbers. Teachers and pensioners will have more money in their bank account, while the unemployed have less.
The effect of the sudden stop on the balance sheets of the three non-financial private sectors is shown in figure 6.
The amount of cash held by NFC_C falls because of outflows to NFC_O (e.g. rent) and HH (salaries).
Automatic stabilizers
How does the sudden stop affect tax revenue? And how does the state react?
Figure 7 shows the cash flow changes related to the government.
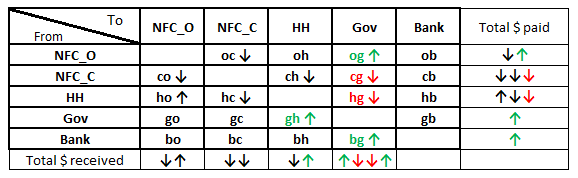
Closed businesses (NFC_C) have no revenue, so they don’t pay value added tax (cash flow cg in figure 7). Unemployed workers no longer pay payroll taxes. Taxes on the extra sales of NFC_O (cash flow og in figure 7) only partially offset the revenue loss for the state.
At the same time, the state pays unemployment benefits to employees who lost their job. Unemployment benefits are automatic stabilizers: they soften the blow to workers’ incomes.
The deficit is financed by issuing bonds. In the model, the bonds are bought by banks, so there is a cash flow from banks to the government (cash flow bg in figure 7).
Figure 8 shows the effect of the government on the balance sheets on the five sectors.
The cash crunch
Let’s return our focus to the corporate sector.
Figure 9 shows the balance sheets of three companies. Company 1 has bought inventory from company 2. The inventory is funded by an account payable. Company 2 in turn has an account payable to company 318. If you don’t like abstract examples, imagine that company 1 is a fashion store that bought a stock of clothes for the season.

Company 1 is closed due to the coronavirus lockdown, so it cannot sell its inventory. Because company 1 doesn’t bring in cash, it cannot settle its account payable to company 2. The cash shortage propagates to companies 2 and 3, who need the money to settle their own bills.
Banks can solve this liquity problem. Figure 10 shows how it works.
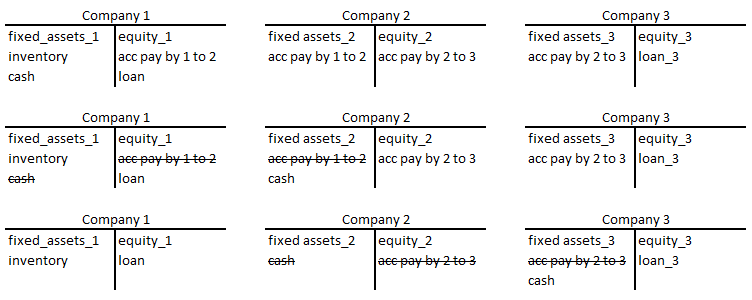
Company 1 borrows money from a bank (top row in figure 10). Company 1 uses the cash to settle its account payable to company 3 (middle row). Company 2 then pays company 3 (bottom row).
The non-financial corporate sector delevers (the balance sheets of companies 2 and 3 shrink) thanks to the bank’s expanding balance sheet, as shown in figure 11.
Banks can also relieve the liquidity shortages of their clients by suspending loan and mortgage repayments. Governments have granted tax deferrals to companies and households hit by the corona shock.
However, banks are not eager to provide credit to everyone who is short of cash. Banks fear losses19 on their credit portfolio due to the solvency crisis, which is discussed in the next chapter.
The solvency crisis
How long can a business survive when its revenue goes to zero?
Figure 12 shows the balance sheet of a business20. It has no debt and its assets are only cash.
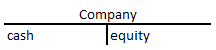
This looks very robust, but is it?
Suppose that before the crisis
- Profit is 10% of revenue
- Variable costs are 50% of revenue
- Fixed costs are 40% of revenue
When the business closes, it accrues costs at a rate of 40% of its normal sales during that period. When there is a 3 month lockdown, the company loses a whole year’s profits.
However, this is a very optimistic scenario. Higher fixed costs21 and lower profit margins make the calculation worse.
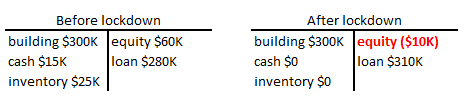
Consider a more realistic example. A fashion store has a quarterly revenue of $100K. Its fixed expenses are $45K and variable expenses are $50K. Quarterly profit is $5K. The equity is $60K, i.e. three years of retained earnings.
Figure 13 shows the quarterly P&L statement before and after a three month closure. Inventory has to be written off, because fashion changes with the seasons. The fashion store loses $70K.
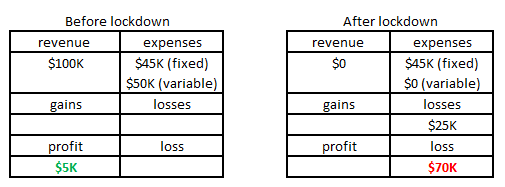
Figure 14 shows the balance sheet before and after the corona closure. Equity is wiped out, there is no more cash and debt has increased. A three month disruption has ravaged the balance sheet. It would take 3.5 years to rebuild the balance sheet to the status quo before the corona crisis.
The business owner would make a rational decision to let the limited liability company go bankrupt. But that means that the bank who lent money will suffer credit losses. Fire sales of the remaining assets will depress real estate prices.
A wave of liquidations and personal bankruptcies has a negative effect on employment, banks, real estate investments and tax revenue. When businesses close down en masse, firms22 who escaped the corona crisis unscathed will take a hit.
Chosing a better future
We don’t have to accept that the coronavirus will result in a long depression.
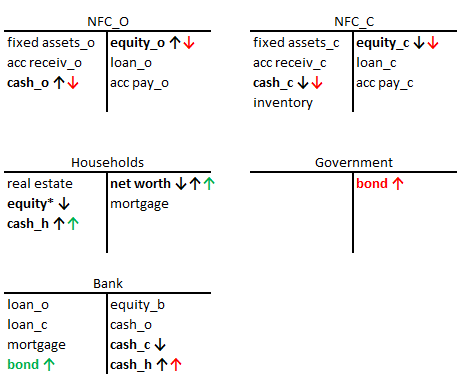
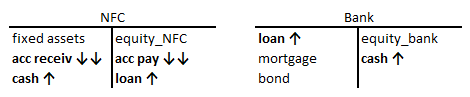
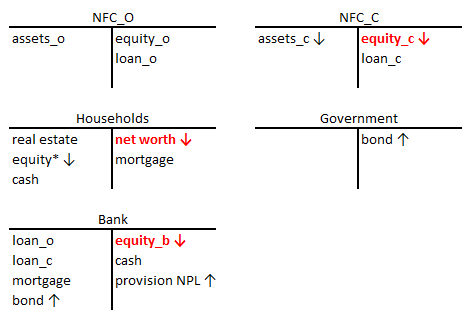
Figure 15 summarizes the main effects of the corona crisis on the five sectors. The equity of NFC_C is devastated, as is the net worth of households. Banks book provisions for non-performing loans (NPL), so their equity drops. Government debt is up. The figure does not take into account second-round effects, where liquidations result in lower real estate prices and lower revenue for NFC_O.
The situation seems hopeless, until you adopt the MMT mindset. Is it really a problem that government debt is higher? What if the state transfers money23 to households and businesses?
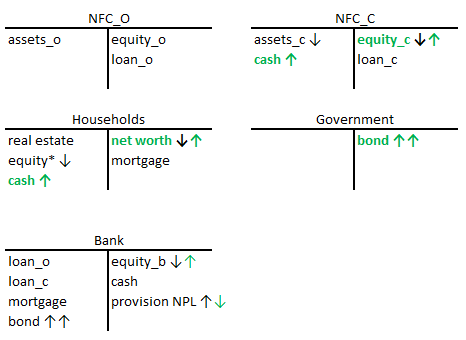
Yes, government debt would rise even faster. But by transferring resources to the private sector, the state would preserve its most precious (off-balance) asset: a vibrant economy. Figure 16 shows the balance sheets of the five sectors when the government compensates those hit by a corona-induced income shock.
The alternative is austerity. Politicians are already warning that they will raise taxes ‘to pay for the corona crisis’. But extra taxes will have a negative effect on household net worth and expenditure. A pathological obsession with government debt will nip the post-corona recovery in the bud!
Former ECB President Mario Draghi wrote
The speed of the deterioration of private balance sheets — caused by an economic shutdown that is both inevitable and desirable — must be met by equal speed in deploying government balance sheets
Mario Draghi
Indeed, let’s deploy the government balance sheet. Let the government run a deficit equal to 2% of annual GDP for every month of the health crisis. Once the virus is contained, helicopter money can support the economic recovery without adding more government debt.
Congratulations for making it all the way to the end! If you find this analysis interesting, you should read my book Bankers are people, too.

- Some businesses are literally closed on government orders (e.g. non-essential shops). Others continue operating but face a dramatic drop in revenue (e.g. public transport).
- Households have multiple economic roles: consumers, workers (active and unemployed), economically inactive people (e.g. pensioners and children), savers, and investors.
- Coins and bank notes are technically liabilities of the central bank.
- The accounts receivable (payable) of the two NFC categories are accounts payable (receivable) both to businesses within the same category and to businesses within the other category. For example, a NFC_O company can have an account payable by another NFC_O and another account payable by a NFC_C company.
- Why is total expenditure not equal to total income if we include the bank sector? That is because banks create money. So banks can pay a counterparty by making a loan, without simultaneously borrowing the money from the rest of the economy.
- The expenditure of a single sector can be higher than its aggregate income if it spends money it had previously saved.
- The entire economy = the five sectors combined.
- Bank costs include salaries, payments to suppliers and interest on the bank’s liabilities.
- Oil prices also started falling around February 20th. And the virus caused some supply chain issues. However, these are minor effects compared to the rest of the model. Others have written about the cracks in the credit markets. I will add links once I have time to read.
- Due to increased risk aversion, a deteriorating economic outlook, uncertainty or whatever reason.
- Profit margins vary widely between industries and firms.
- Keep in mind that HH is the aggregate of all private persons. Equity* is predominantly owned by the rich. But the wealth of middle class families also depends on stocks (through pension plans, mutual funds, ETFs or insurance products).
- Unemployment benefits and other income support.
- -30% + 6% = -24%. I assume HH spending = consumption and that government consumption remains constant.
- -10% + 4% = -6%
- 24%/12 months = 2%
- (-10% income from NFC_C + 4% Gov transfers – (-24% not spent))/12 months = (+18%/12 months) => net cash savings per month = 1.5% of annual GDP
- The account payable by 2 to 3 is an account receivable of company 3. I use the same name on both balance sheets to make clear that one company’s liability is an asset for the other.
- Some governments have issued loan guarantees to remove the credit risk taken by banks.
- The example also works for HH, simply replace equity by net worth.
- Many companies have high fixed costs. Think about capital intensive industries (hotels, airlines…), and self-employed workers (hairdressers, freelancers…)
- Accountants, insurance agents, software vendors…
- Not all of the transfer needs to be cash. For example, the government could subsidize the fixed costs of businesses with 50% in cash and 50% as a deferred tax asset. This solution would be an incentive not to file for bankruptcy.
Hey this is great. I think the most straightforward description/explication I’ve seen of SFC, that at least a typical businessperson could understand.
I think you have a typo here:
households (HH) make a payment co to NFC_O
should be ho, no?
Probably need to add a State/Local Gov sector? Big #s there.
The hard part of course is the assumptions, entities’ reaction functions. But I think this is a very nicely laid-out framework for thinking through those.
Cheers,
Steve
Thanks Steve!
Yes that was a typo, corrected now.
I’ll try to estimate the effect of the Gov in the next couple of weeks.
I agree that the reaction functions are the hardest part.