
Video version here:
This post contains links to sources and some extra analyses.
After years of low inflation, inflation in Europe has gone through the roof. Germany is experiencing the highest inflation in 70 years.
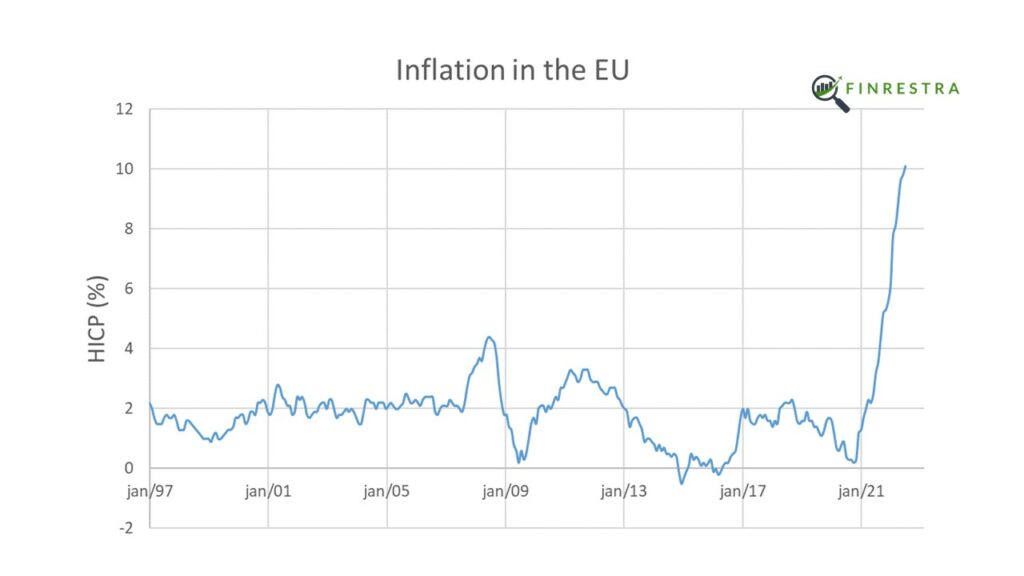
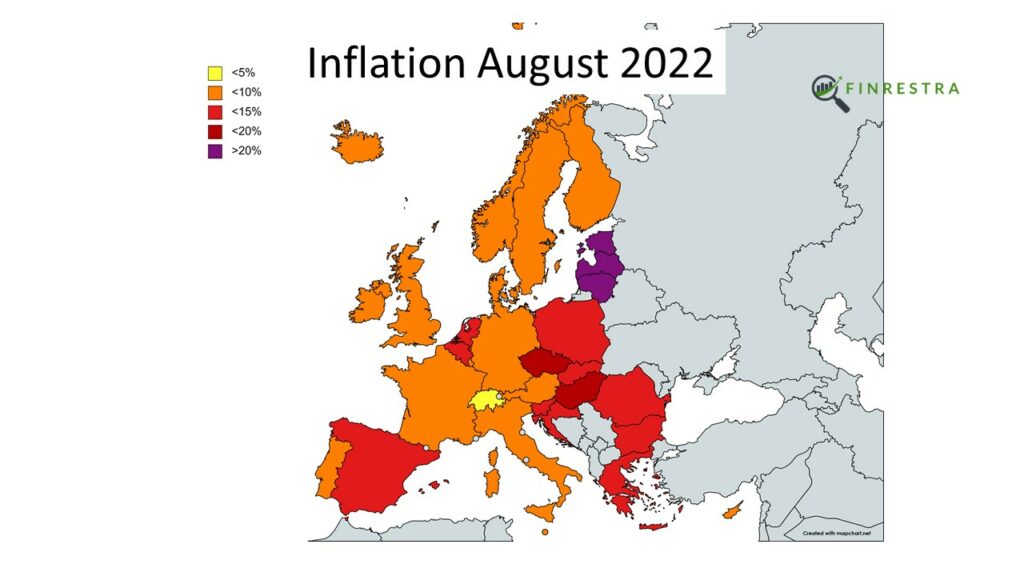
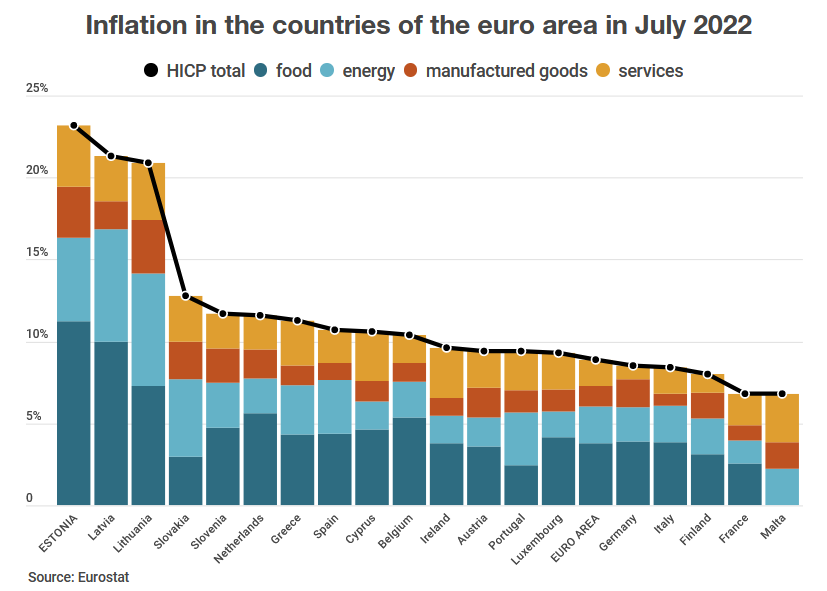
In June 2021, inflation was still close to 2%. In August 2022, it was above 10% in the European Union (EU) as a whole. But that number hides a remarkable divergence between countries. In Estonia, inflation reached a stunning 25% in August 2022. In France, it was 6.6%. In Switzerland, not an EU member state, inflation was just 3.3%.
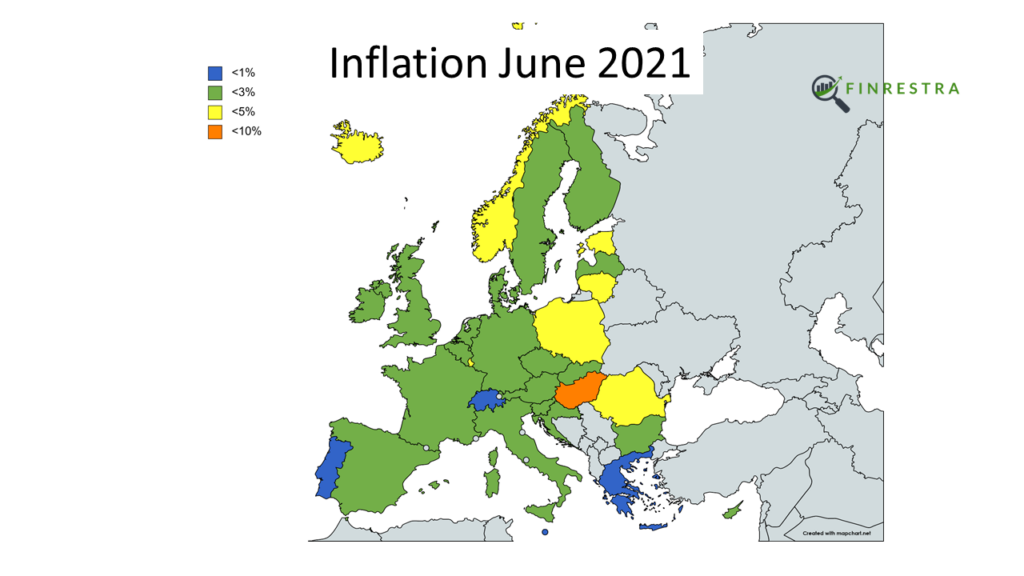
A year before, in June 2021, inflation was very close to 2% in most European countries. With 5.3%, Hungary had the highest inflation. Inflation was lowest in Portugal, at -0.6%.
In this post, we’ll look at the change of inflation in 31 countries: the 27 member states of the EU, and the United Kingdom (UK), Norway, Switzerland and Iceland.
How can we explain the dramatic, uneven rise in inflation?
Energy intensity
Consumers are paying a lot more for energy than they used to. Companies also face higher energy bills, which has an impact on the price of their goods and services.
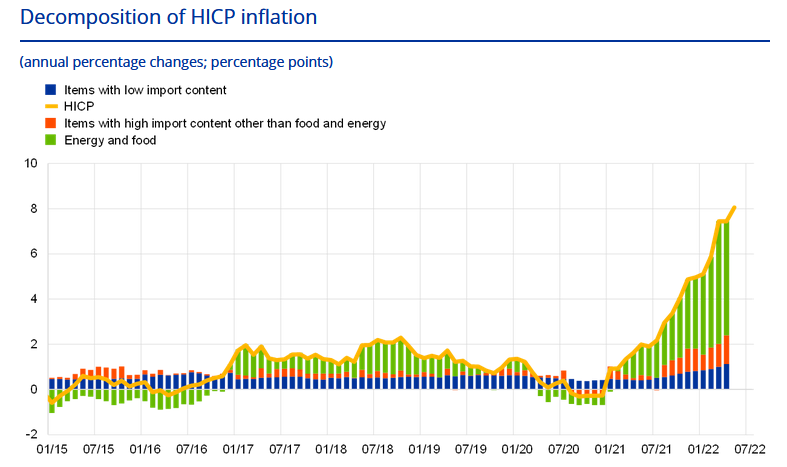
But energy prices are set on international markets, e.g. for oil, gas, coal and electricity. Why doesn’t expensive energy result in a similar rise of inflation across Europe?
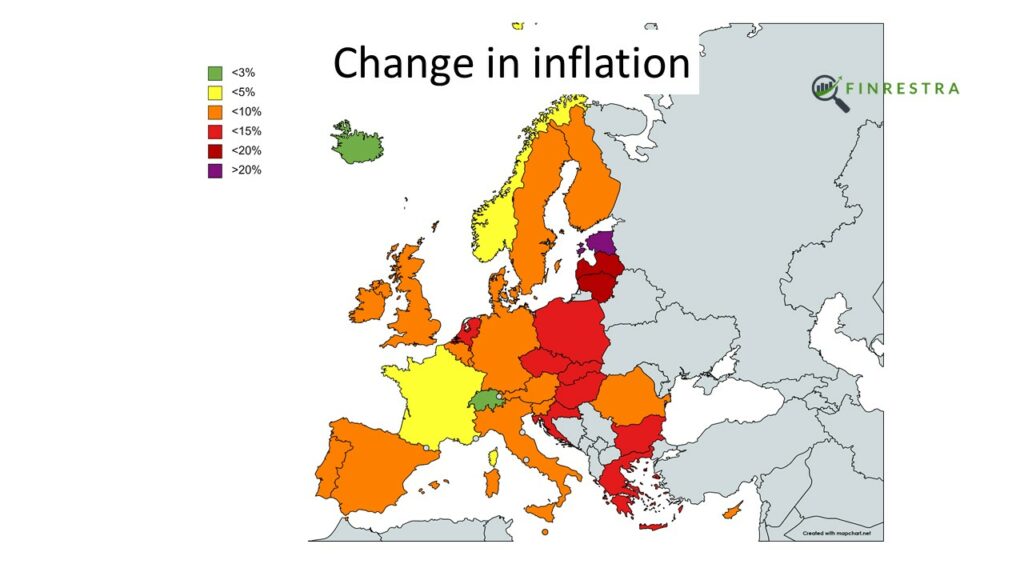
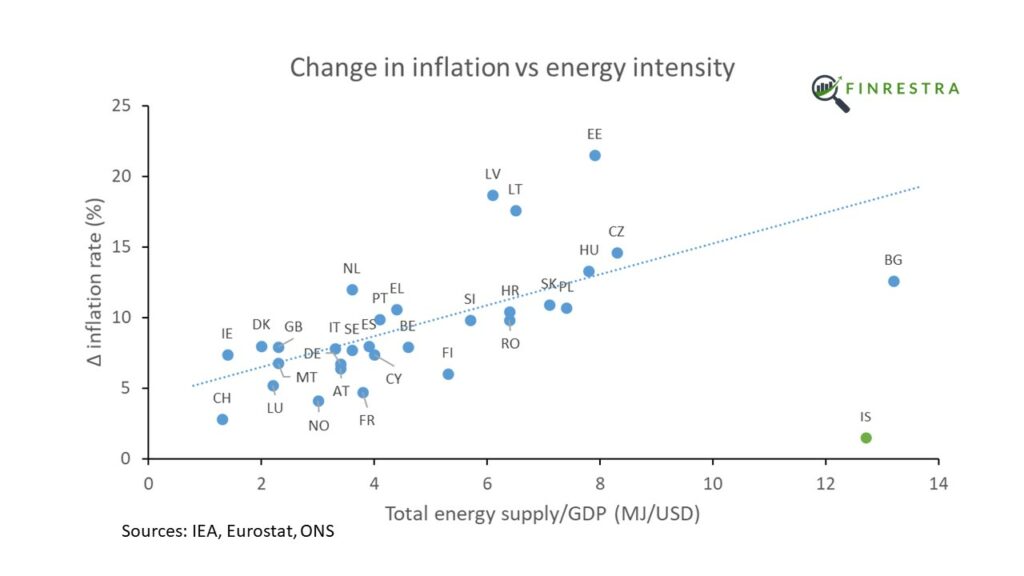
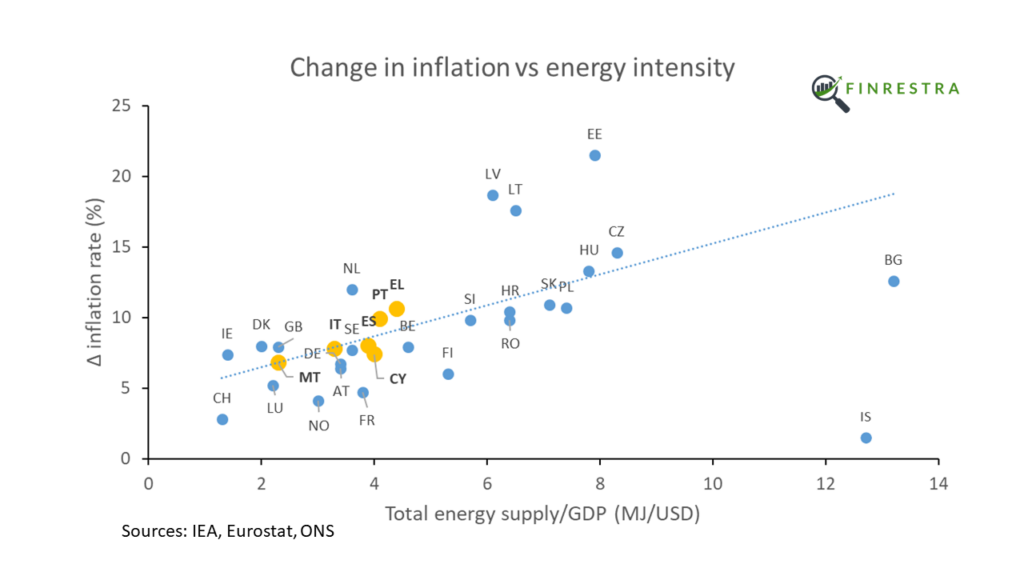
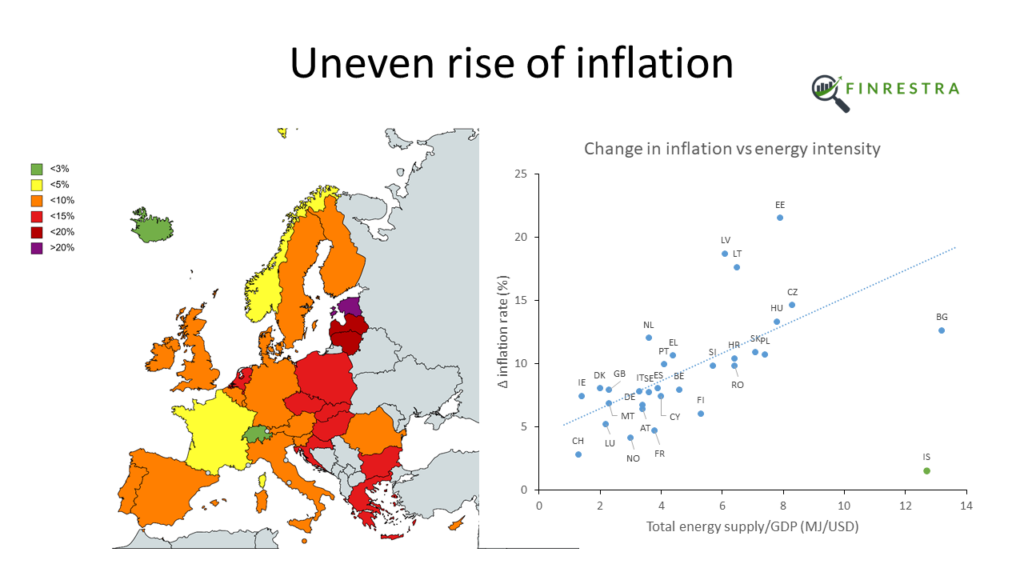
As the following figure shows, there is a strong correlation1 between the rise of inflation and the ratio of energy use to GDP2. As a general rule, the more energy a country needs to produce a dollar of economic output, the higher its inflation. Countries in Central and Eastern Europe have higher energy intensities and higher inflation rates than their Western European neighbors.
Countries with a lower GDP per capita tend to be more energy intensive.
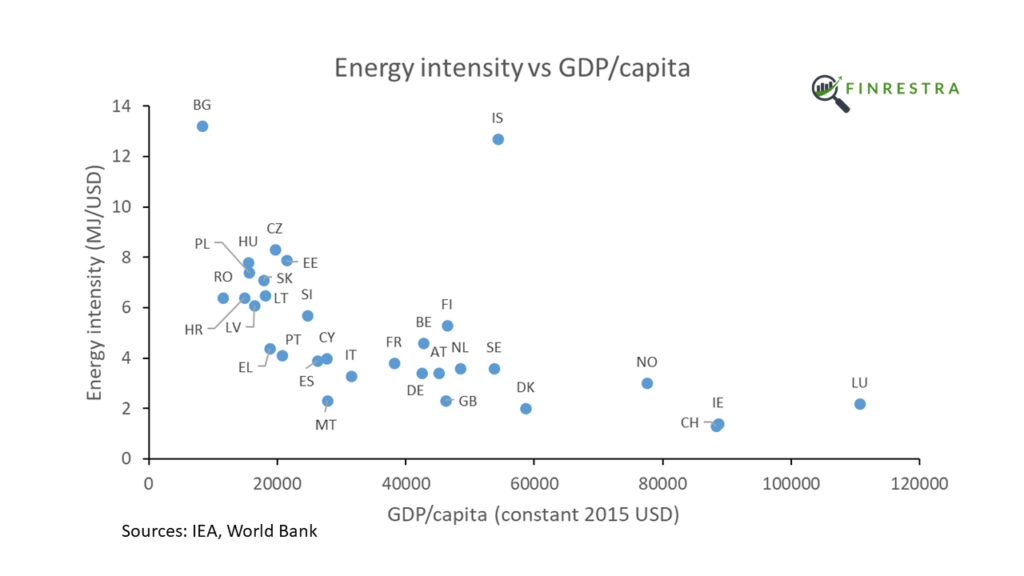
So it’s not surprising that Central and Eastern European countries, who are relatively poor, are experiencing higher inflation than the West3.
But it’s not just an East-West story. Even within regions with similar GDP per capita, the more energy intensive countries experience higher inflation. For example Central Europe4,
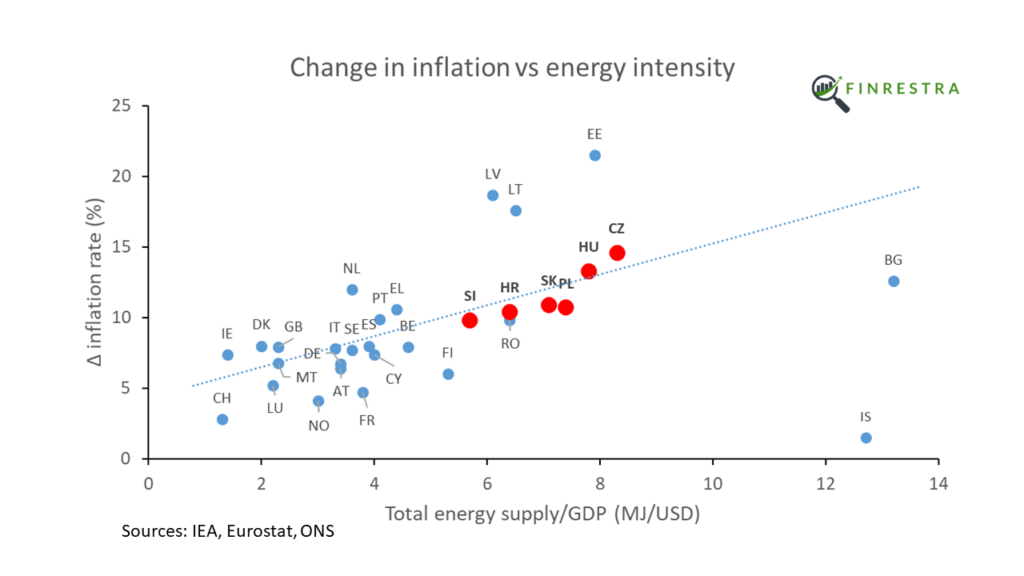
Southern Europe5,
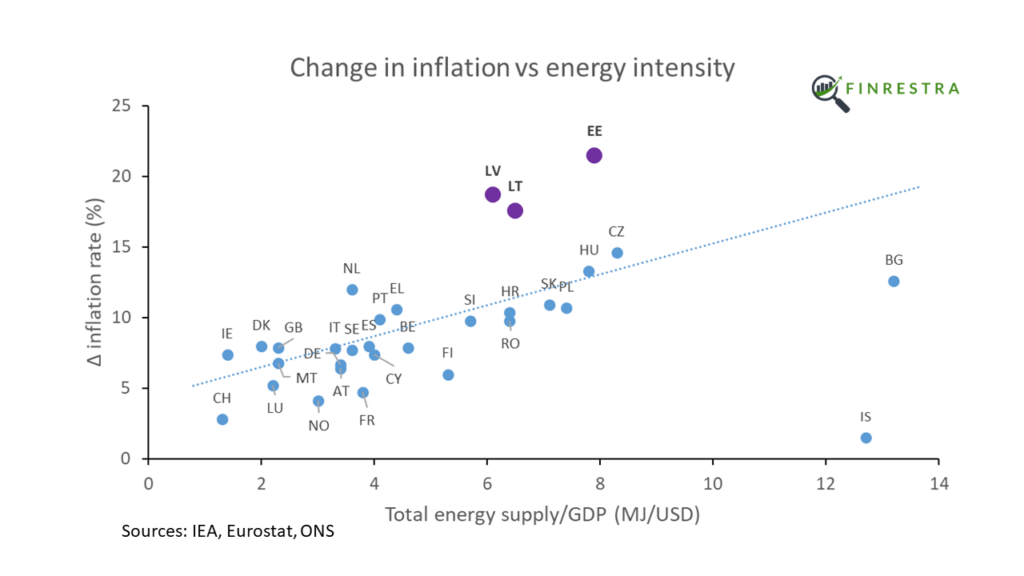
and the Baltics6.
The picture is less clear in Western Europe. The energy intensity of Luxembourg and Ireland is distorted by the denominator (small countries with a very high GDP per capita due to the presence of international companies). France already limited energy prices in 2021. The Nordic countries are just weird ¯_(ツ)_/¯
What’s going on in Iceland? Iceland is a rich country with an abnormally high energy use. Why doesn’t this result in much higher inflation?
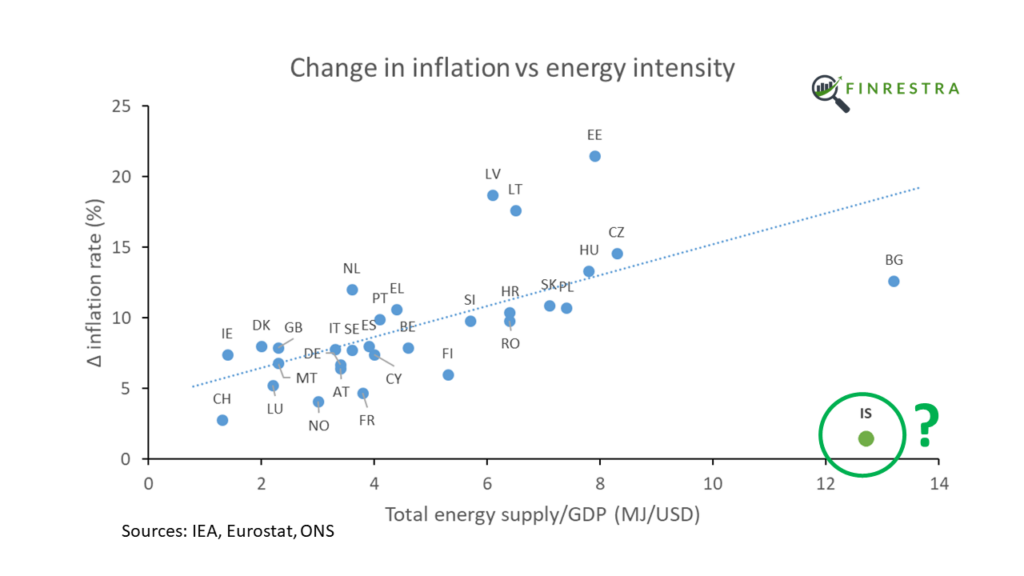
Although Iceland is a small nation, it’s a big producer of aluminum.
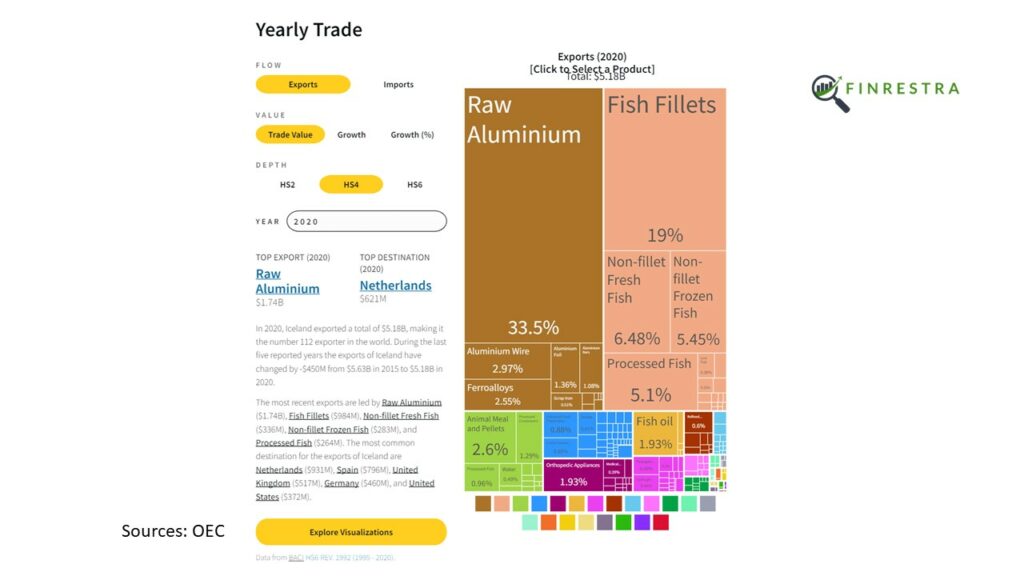
Making aluminum requires a lot of electricity. But all of Iceland’s electricity is generated from renewable sources.
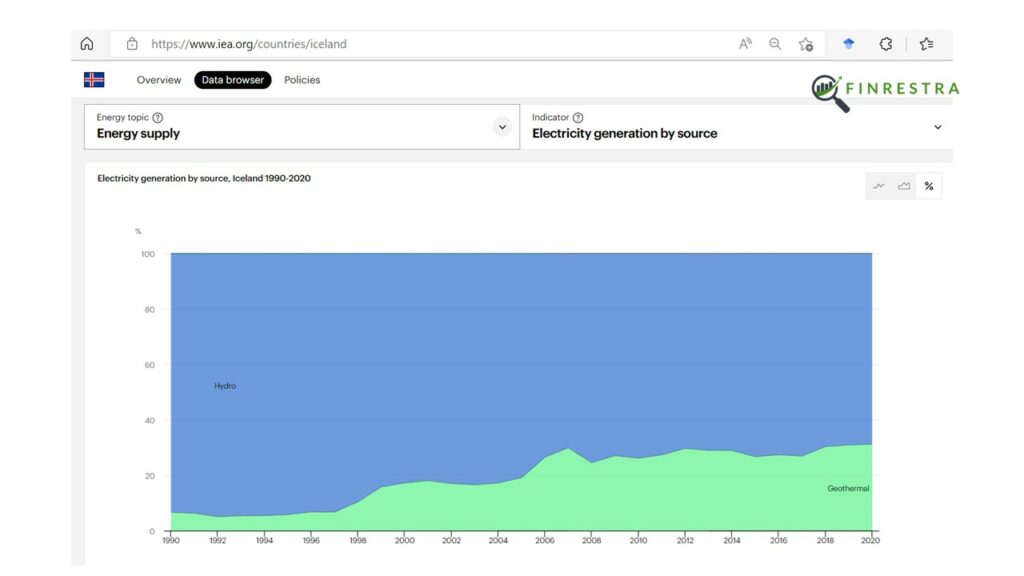
So the Icelandic economy is less affected by higher fossil fuel prices than the rest of Europe. Fossil-free electricity also seems to be the explanation for the very low inflation in Switzerland.
Unemployment
What other factors could contribute to the rise of inflation?
According to economic theory (NAIRU, Phillips curve), when unemployment is “too low”, workers demand higher wages. And higher wages lead to higher prices.
However, there is no correlation7 between unemployment8 and the change of inflation in Europe.
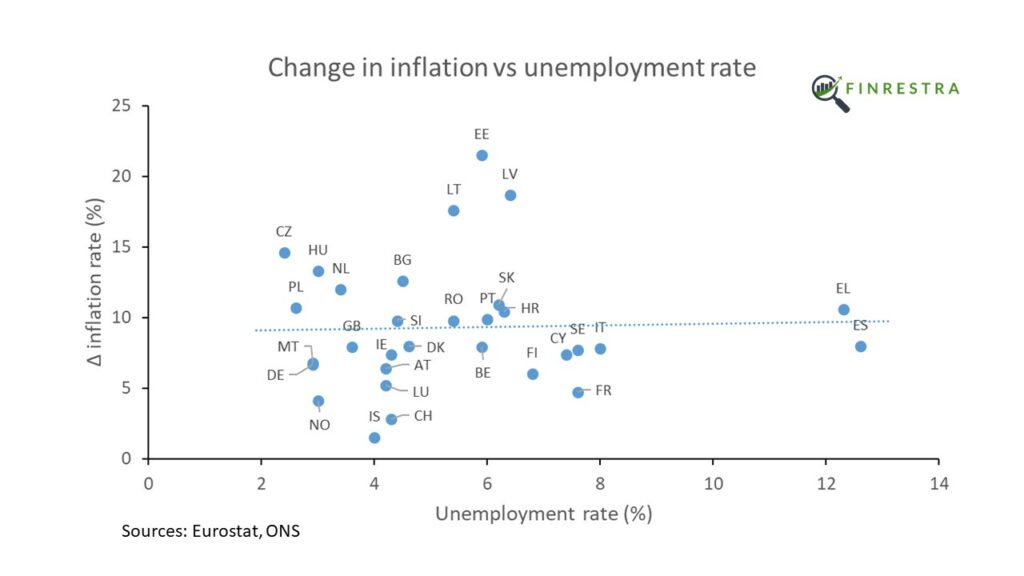
Inflation rose more in Spain and Greece than it did in Germany, although the German unemployment rate is much lower.
Government deficits and debt
Do deficits cause inflation (Fiscal theory of the price level)? It makes intuitive sense that if the government spends more money into the economy than it takes away with taxes, this deficit leads to inflation.
However, there is no correlation9 between government deficits10 and the rise in inflation.
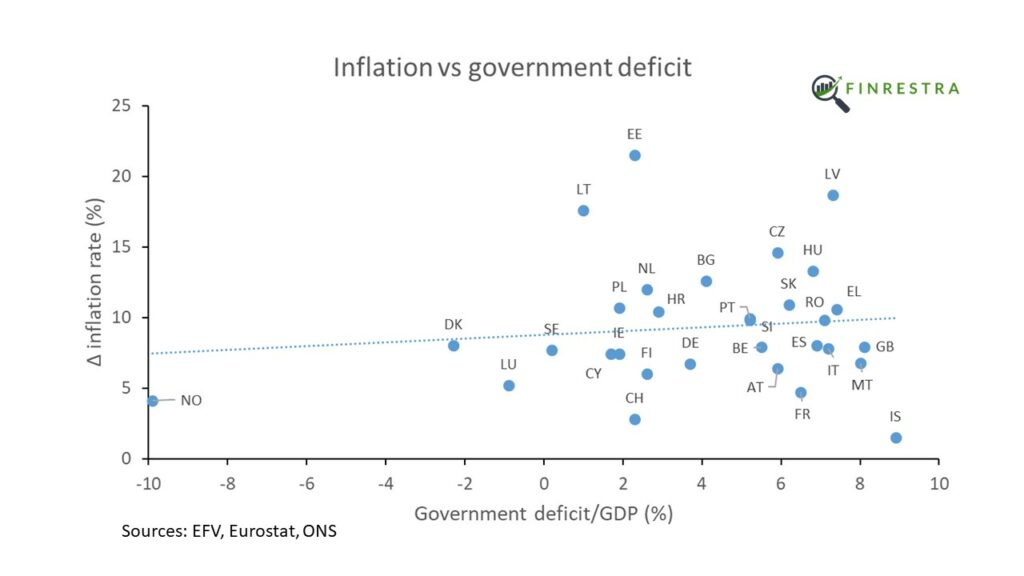
Denmark and the UK have the same change in inflation, although the Danish government ran a budget surplus in 2021, while the British had an 8.1% deficit. Finland and Estonia had similar deficits, but their inflation numbers are very different.
What about public debt? Maybe inflation goes up because people lose confidence in the sustainability of the debt. Or because governments choose to inflate away the debt.
However, there is a slightly negative relation11 between government debt and inflation12.
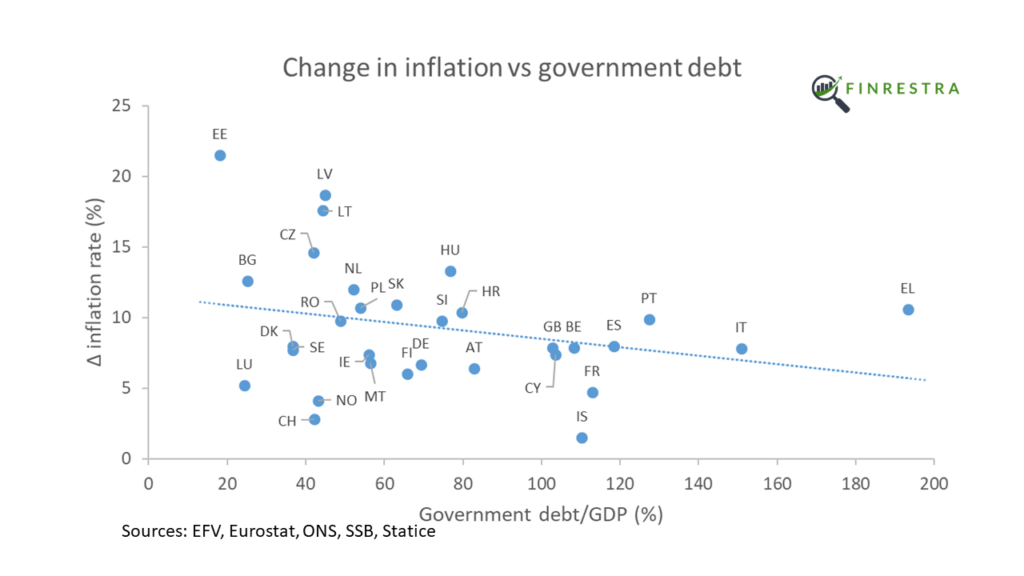
Greece, with its massive government debt, has experienced a smaller rise in inflation than the Baltic countries, where government debt is very low. Estonia has both the lowest government debt to GDP, and the highest inflation in Europe! Inflation is higher in the Netherlands than it is in Italy, although Italy’s debt-to-GDP ratio is almost 100 percentage points higher.
Central bank interest rates
Central bankers try to control inflation by changing interest rates. By influencing how expensive it is to borrow money, they influence prices of goods and services.
The picture shows central bank policy rates13 on June 1, 2022. Since that time, central banks have raised interest rates in an attempt to tamp down inflation.
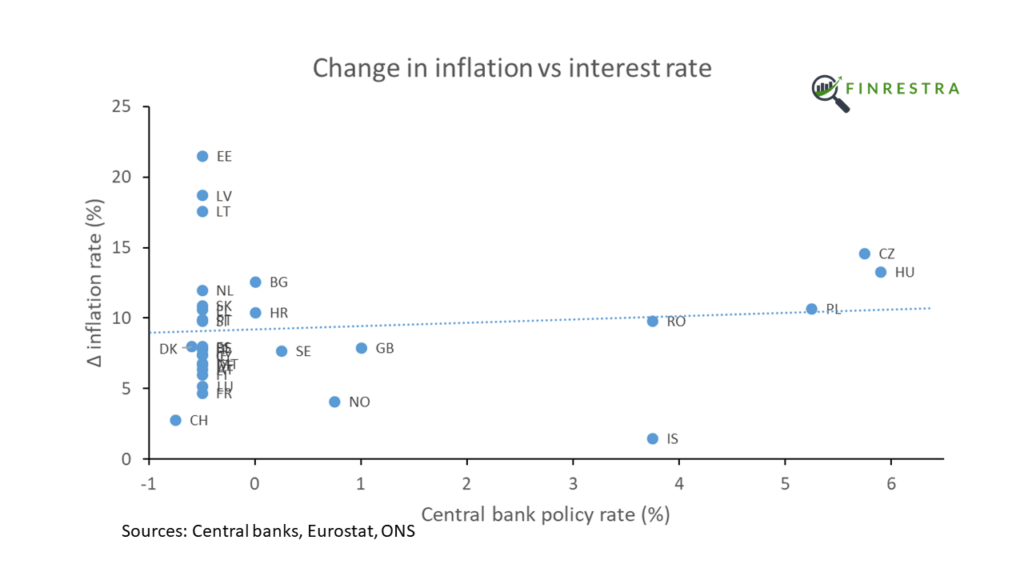
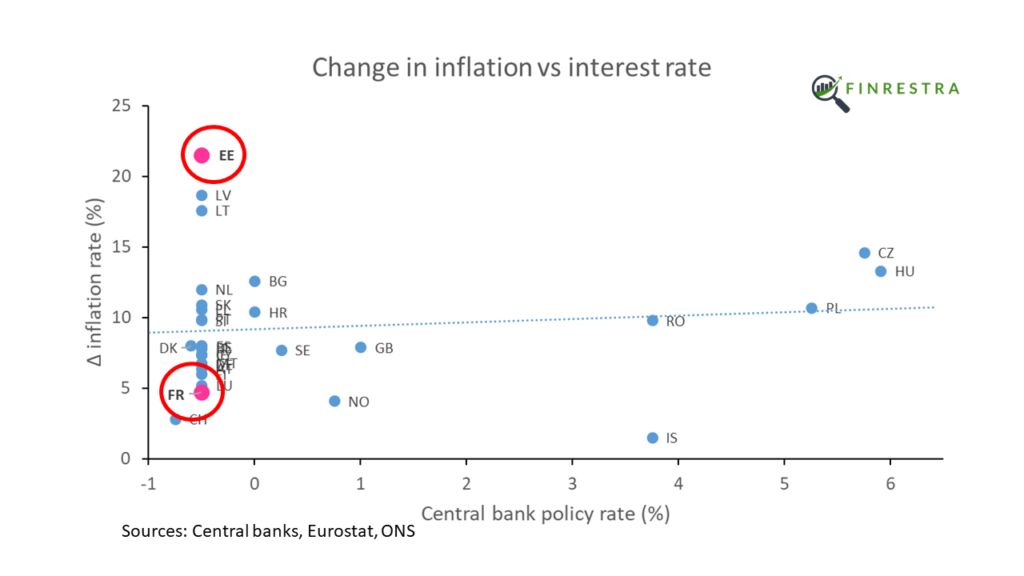
But it’s not clear that interest rates have an effect on Europe’s inflation. In the euro area, where the ECB sets monetary policy for all 19 member states, inflation rose by 4.7% in France and 21.5% in Estonia.
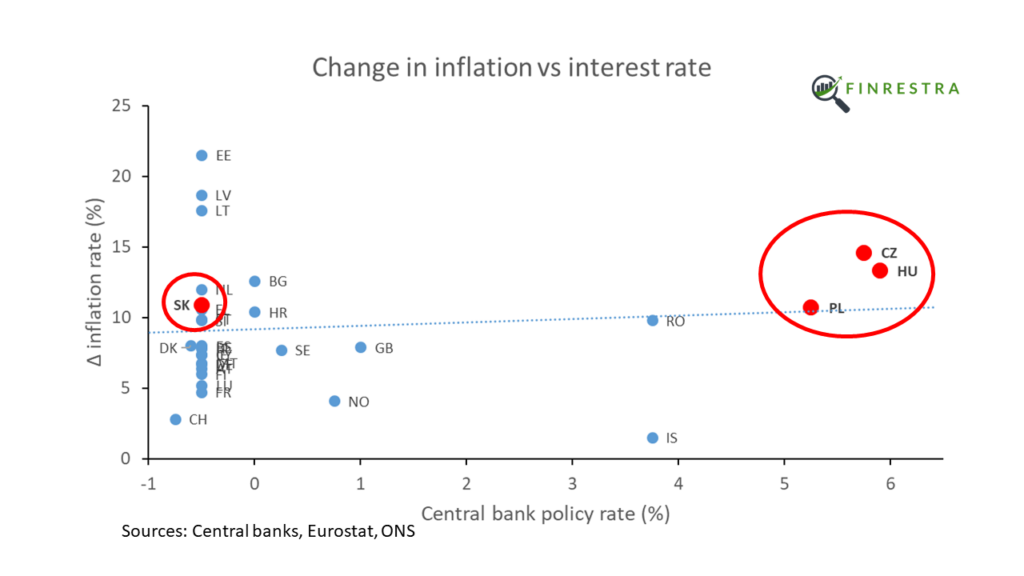
In Slovakia, a country with a negative interest rate, the rise in inflation (+10.9%) is similar to neighboring Czech Republic (+14.6%), Hungary (+13.3%) and Poland (+10.7%), where policy rates were over 5%.
Conclusion
In conclusion, Europe’s worse inflation in generations is driven by energy. Conventional factors monitored by central banks don’t seem to play a role.
Contact
This work started as a small project I did during the summer, using June 2022 inflation instead of the change of inflation (see tweet below). In this post and in the video, I used the latest available data. I also added six countries (Bulgaria, Croatia, Cyprus, Malta, Romania14 and Iceland) to the dataset.
If you have any questions or suggestions about this work, you can find me on Twitter @janmusschoot or mail me at jan.musschoot@finrestra.com.
For my professional services, please contact me on Linkedin or mail me at jan.musschoot@finrestra.com.
Statistical robustness
Twitter user Rasmus checked the data points I posted in June. His test shows that the regression line slope is different from zero:
Some further thoughts about energy prices
It is remarkable that there is such a strong correlation between inflation and energy intensity, given the different energy mix between countries. For example, natural gas is the most important fuel in Italy. Poland mostly burns coal, while Sweden relies on wood. While natural gas and coal prices are up hundreds of percent, that’s not the case for oil or nuclear.
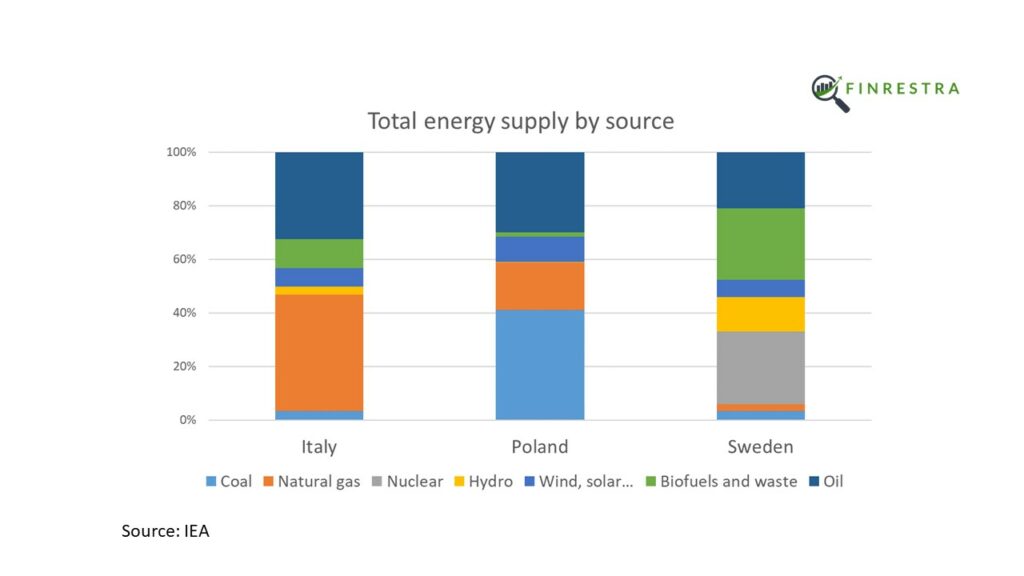
I suspect the strong relation is due to electricity prices, which are often determined by the price of natural gas.
Other complicating factors that my analysis doesn’t take into account are price caps for energy (e.g. France), and the energy intensity of exporting industries (which should have less of an effect on domestic consumer price inflation).
What’s the deal with the Baltics?
The three Baltic countries (Estonia, Latvia and Lithuania) are outliers. Their inflation is much higher than we’d expect based on their energy intensity. It’s not obvious that the fact that they share a border with Russia is the explanation. Finland, a euro country like the Baltics, also borders on Russia and has a relatively low inflation.
According to the central bank of Estonia:
There are several reasons why inflation is higher in the Baltic states than the average in the euro area. The share of energy goods in the purchasing basket of consumers in the Baltic states is larger, which has affected the rise in the price of the consumer basket. Natural gas and electricity were a little cheaper in the region before Russia’s invasion of Ukraine, but prices have now caught up to those in other countries.15
Useful energy-related links:
Energy statistics – an overview (Eurostat)
From where do we import energy? (Eurostat)
European natural gas imports (Bruegel)
Carbon intensity electricity (Electricity maps)
Electricity prices (euenergy.live)
Real-time electricity tracker (IEA)
National policies to shield consumers from rising energy prices (Bruegel)